Nicholas Wright
Introduction
The Toronto-based Franco-Nevada Corporation (NYSE:FNV) released its second-quarter 2023 results on August 8, 2023.
Note: I have been covering FNV quarterly on Seeking Alpha since March 2017. This article is an update of my preceding article, published on May 3, 2023.
Franco-Nevada owns 428 assets worldwide:
FNV Portfolio as of August 8, 2023 (FNV Press release)
CEO Paul Brink said in the conference call:
For Q2, our core assets returned to normal production and deliveries at Cobre Panama and Antapaccay caught up from the disruptions in Q1. Revenue from our diversified assets was impacted by lower oil, gas and iron ore prices compared to the relative highs in the prior year period. As a result, we expect total GEOs for the year to be at the low end of our guidance range.
1 – Q2’23 Quick Snapshot
Franco-Nevada came out with adjusted quarterly earnings of $0.95 per share, or $182.9 million. The company generated $329.9 million in the second quarter, down 6.4% from last year’s quarter.
The decline was due to lower commodity prices for its Energy assets, offsetting higher revenues from Precious Metal assets.
Metals production in GEOs was lower than a year ago, with 132,033 GEOs sold (Gold, Silver, PGM) compared with 131,574 GEOs last year. Also, total GEO Production, including Energy, was 168,515 GEOs compared with 191,052 GEOs in Q2’22.
This quarter’s energy revenues were down significantly, reaching only $55.5 million compared with $49.0 million in the preceding quarter.
Below are the revenues per segment in the second quarter of 2023:
FNV 2Q23 Revenue per segment (Fun Trading)
The company is highly dependent on the gold price, representing 64.8% of the total revenues Q2’23. The energy sector dropped significantly this quarter and now represents 16.8%.
2 – Stock Performance
As I have indicated for years, Franco-Nevada is one of my most significant long-term investments in the streaming sector, followed closely by Wheaton Precious Metals (WPM). I also own a smaller long-term position in Sandstorm Gold Ltd. (SAND), but I am not very happy about it.
Franco-Nevada Corporation’s fundamentals are solid, with no debt and a cash position of $1,295.1 million, up $46.7 million quarter over quarter.
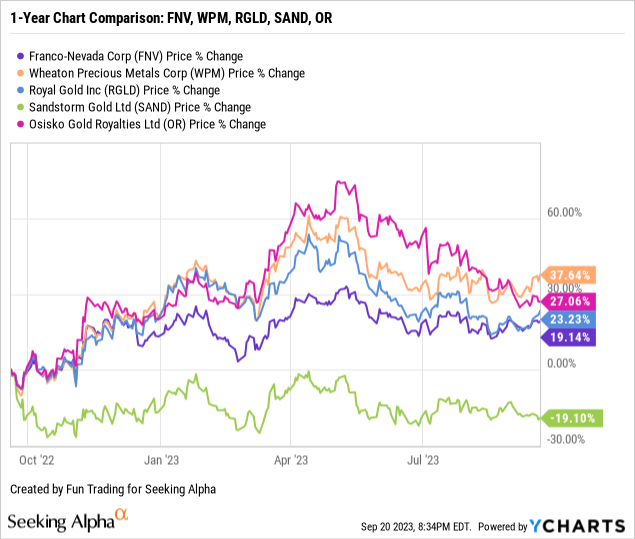
FNV is up 19% on a one-year basis, whereas WPM is up 38%. SAND is the laggard here, with a negative 19% YoY.
3 – Investment Thesis
Franco-Nevada Corporation presents a low-risk profile, with 89% of assets located in the Americas, which is excellent support from a long-term investment perspective.
However, despite a solid balance sheet with a record total cash of $1,295.1 million as of June 30, 2023, the company still refuses to hike dividends to a minimum yield of 3%, which is quite surprising and not shareholders-friendly. On the other hand, FNV is not the only one in the streaming and Royalty segment. WPM, SAND, RGLD, and others pay the same inadequate dividend.
However, it remains my leading investment in the streamer group.
FNV Diversified Portfolio (FNV Presentation)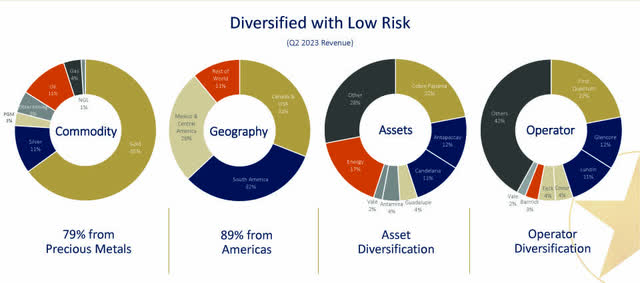
Despite this pristine balance sheet, the company is still highly sensitive to the price of Gold, and it is crucial to monitor commodity prices and trade FNV accordingly.
The FED decided today to keep interest rates at the same level but indicated that it would raise interest rates by another 25 points in December (hawkish), which is not the best news for gold.
Gold bullion traded above $1,925 per ounce and might strengthen further in early 2024 when the FED is expected to pause indefinitely. Meanwhile, we should brace for volatility in the next few months.
Thus, I recommend trading FNV short-term LIFO 30%-40% of your position and keeping the remainder for a much higher target.
Franco-Nevada – A Solid Balance Sheet and Production in Q2’23, The Raw Numbers
| Franco-Nevada | Q2’22 | Q3’22 | Q4’22 | Q1’23 | Q2’23 |
| Total Revenues in $ Million | 352.3 | 304.2 | 320.4 | 276.3 | 329.9 |
| Net income in $ Million | 196.5 | 157.1 | 165.0 | 156.5 | 184.5 |
| EBITDA $ Million | 302.8 | 256.8 | 266.1 | 245.8 | 287.3 |
| Adjusted EBITDA $ Million | 301.2 | 256.7 | 262.4 | 229.4 | 275.6 |
| EPS diluted in $/share | 1.02 | 0.82 | 0.85 | 0.81 | 0.96 |
| Operating Cash Flow in $ Million | 257.3 | 232.3 | 279.3 | 209.8 | 261.9 |
| CapEx in $ Million | 10.3 | 3.1 | 125.0 | 109.6 | 162.0 |
| Free Cash Flow in $ Million | 247.0 | 229.2 | 154.3 | 100.2 | 99.9 |
| Total cash $ Million | 910.6 | 1,057.4 | 1,196.5 | 1,248.4 | 1,295.1 |
| Long-term Debt in $ Million | 0 | 0 | 0 | 0 | 0 |
| Dividend per share in $ | 0.32 | 0.32 | 0.32 | 0.34 | 0.34 |
| Shares outstanding (diluted) in Million | 191.9 | 192.0 | 194.76 | 192.20 | 192.20 |
| GEOs | Q2’22 | Q3’22 | Q4’22 | Q1’23 | Q2’23 |
| Production gold equivalent K Oz Eq. | 131,574 | 128,427 | 129,642 | 111,238 | 132,033 |
| Production GEO, including Energy | 191,052 | 176,408 | 183,886 | 145,331 | 168,515 |
| Gold price | 1,872 | 1,728 | 1,742 | 1,889 | 1,978 |
Data Source: Company document.
Analysis: Revenues, Earnings Details, Free Cash Flow, Debt, And Production Details
1 – Revenues were $329.9 million in Q2’23
FNV Quarterly Revenue History (Fun Trading) During the second quarter of 2023, the company generated $329.9 million, down from $352.3 million in the same quarter a year ago and up 19.4% sequentially. Net income was $184.5 million, $0.96 per diluted share, compared with $196.5 million or $1.02 per share last year.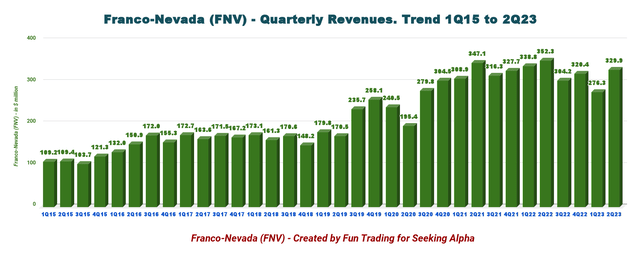
Adjusted EBITDA in Q2’23 was $275.6 million, and Cash Costs were $47.1 million Q2’23.
Oil and gas assets added $55.5 million to Franco-Nevada’s overall quarter results.
2 – Free Cash Flow was estimated at $99.9 million in Q2’23
FNV Quarterly Free Cash Flow History (Fun Trading) Note: The free cash flow is cash from operating activities minus CapEx.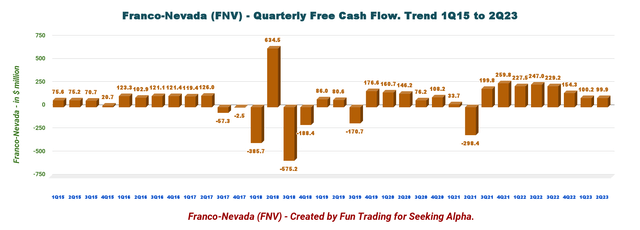
This quarter, the company earned $99.9 million in free cash flow; the trailing 12-month free cash flow was $583.6 million.
Franco-Nevada announced that its Board of Directors had declared a quarterly dividend of $0.34 per share in Q2’23, which is a dividend yield of 1.28%.
As I said regularly, the dividend is still too low. With net cash of nearly $1.3 billion and a quarterly Free Cash Flow of about $100 million, the company should double its dividend at the least.
3 – The Company Has No Debt And $1,295.1 million in cash as of June 30, 2023.
Franco-Nevada continues to deliver another perfect financial profile, with cash and cash on hand of $1,295.1 million in Q2’23 and no debt. The graph below shows how fast cash is increasing rapidly.
FNV Quarterly Cash versus Debt History (Fun Trading)
Also, Franco-Nevada has $2.3 billion in available capital as of June 30, 2023, including $1 billion in credit facility.
4 – Production in Gold Equivalent Ounces was 132,033 GEOs in Q2’23 and 168,515 GEOs, including The Energy Assets
FNV Quarterly GEO Production not including Energy History (Fun Trading)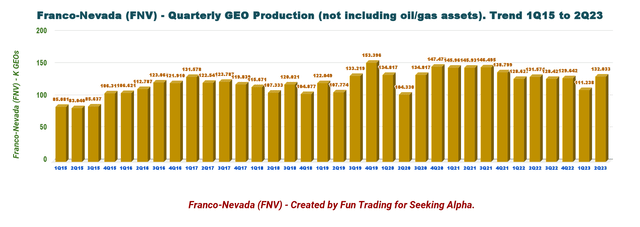
Franco-Nevada stated that it sold 132,033 gold equivalent ounces in Q2’23 (Not including the Energy segment), up from 131,574 GEOs in the same quarter a year ago.
The total production, including the energy segment, was 168,515 GEOs, down significantly from 191,052 GEOs in Q2’22.
FNV Quarterly GEO Production including Energy History (Fun Trading)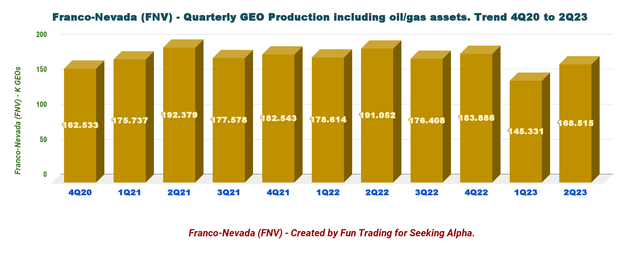
Gold represented 64.6% of the total output in Q2’23, including energy.
Production Details per metal/segment are presented below:
FNV 2Q23 Production per Segment (Fun Trading)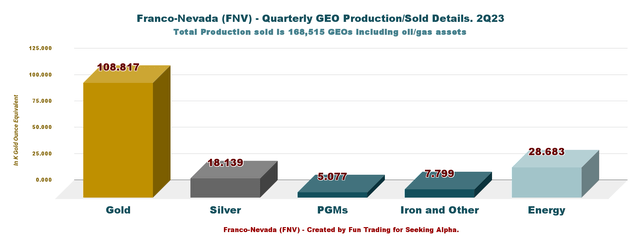
Note: Other metals include mainly Iron for 5,108 GEOs.
- $1,978/oz gold
- $24.18/oz silver
- $1,028/oz platinum
- $1,449/oz palladium
- $112/tonne Fe 62% CFR China.
5 – Guidance 2023 and 2027 Outlook (unchanged)
FNV 2023 Guidance (FNV Presentation)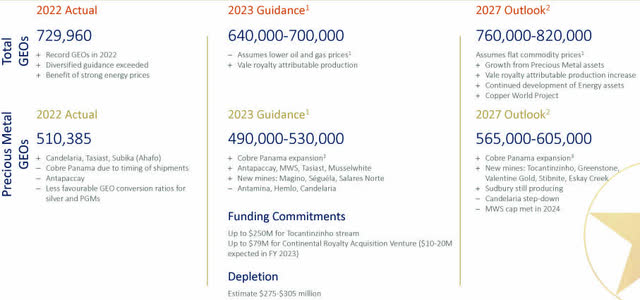
The company also indicated a 2027 Outlook of 760K-820K GEOs, consistent with the 2026 outlook shown in the preceding quarter.
However, CEO Paul Brink indicated in the conference call that 2023 Production will be at the low end of the guidance.
Technical Analysis And Commentary
FNV TA Chart Medium-Term (Fun Trading StockCharts)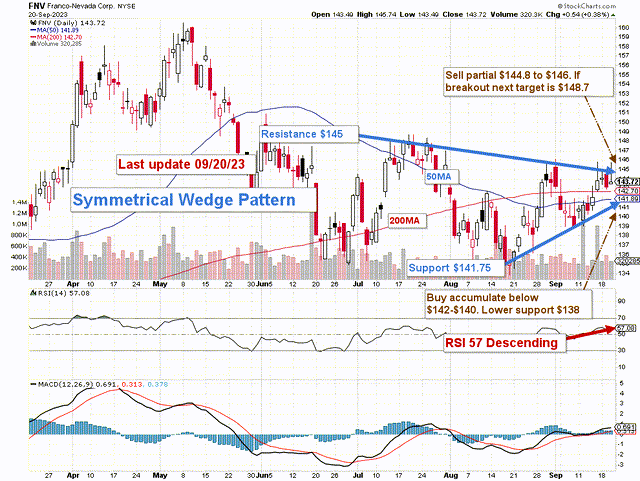
Note: The chart has been adjusted for the dividend.
FNV forms a symmetrical wedge (triangle) pattern with resistance at $145 and support at $141.75.
A symmetrical triangle is a neutral chart pattern that can offer opportunities both long and short traders depending on which side price breaks out.
A symmetrical triangle results when there is an area of indecision within the marketplace where buyers are attempting to push prices higher but are met with resistance by sellers.
The market reaches a pause as the direction of prices is questioned, typically because the forces of both sellers and buyers are equal.
The dominant strategy is to keep a core long-term position and use about 40% to trade LIFO FNV while waiting for a higher final price target for your core position.
I suggest buying Franco-Nevada between $142 and $140 with potential lower support at $138. Conversely, it is reasonable to take profits between $144.8 and $148 with higher resistance at $148.7.
As always, watch the gold price like a hawk.
Warning: The TA chart must be updated frequently to be relevant. It is what I am doing in my stock tracker. The chart above has a possible validity of about a week. Remember, the TA chart is a tool only to help you adopt the right strategy. It is not a way to foresee the future. No one and nothing can.
